Covid Status Dashboard
Displaying dynamic Covid data for an at-a-glance look at the most important numbers.
Concept
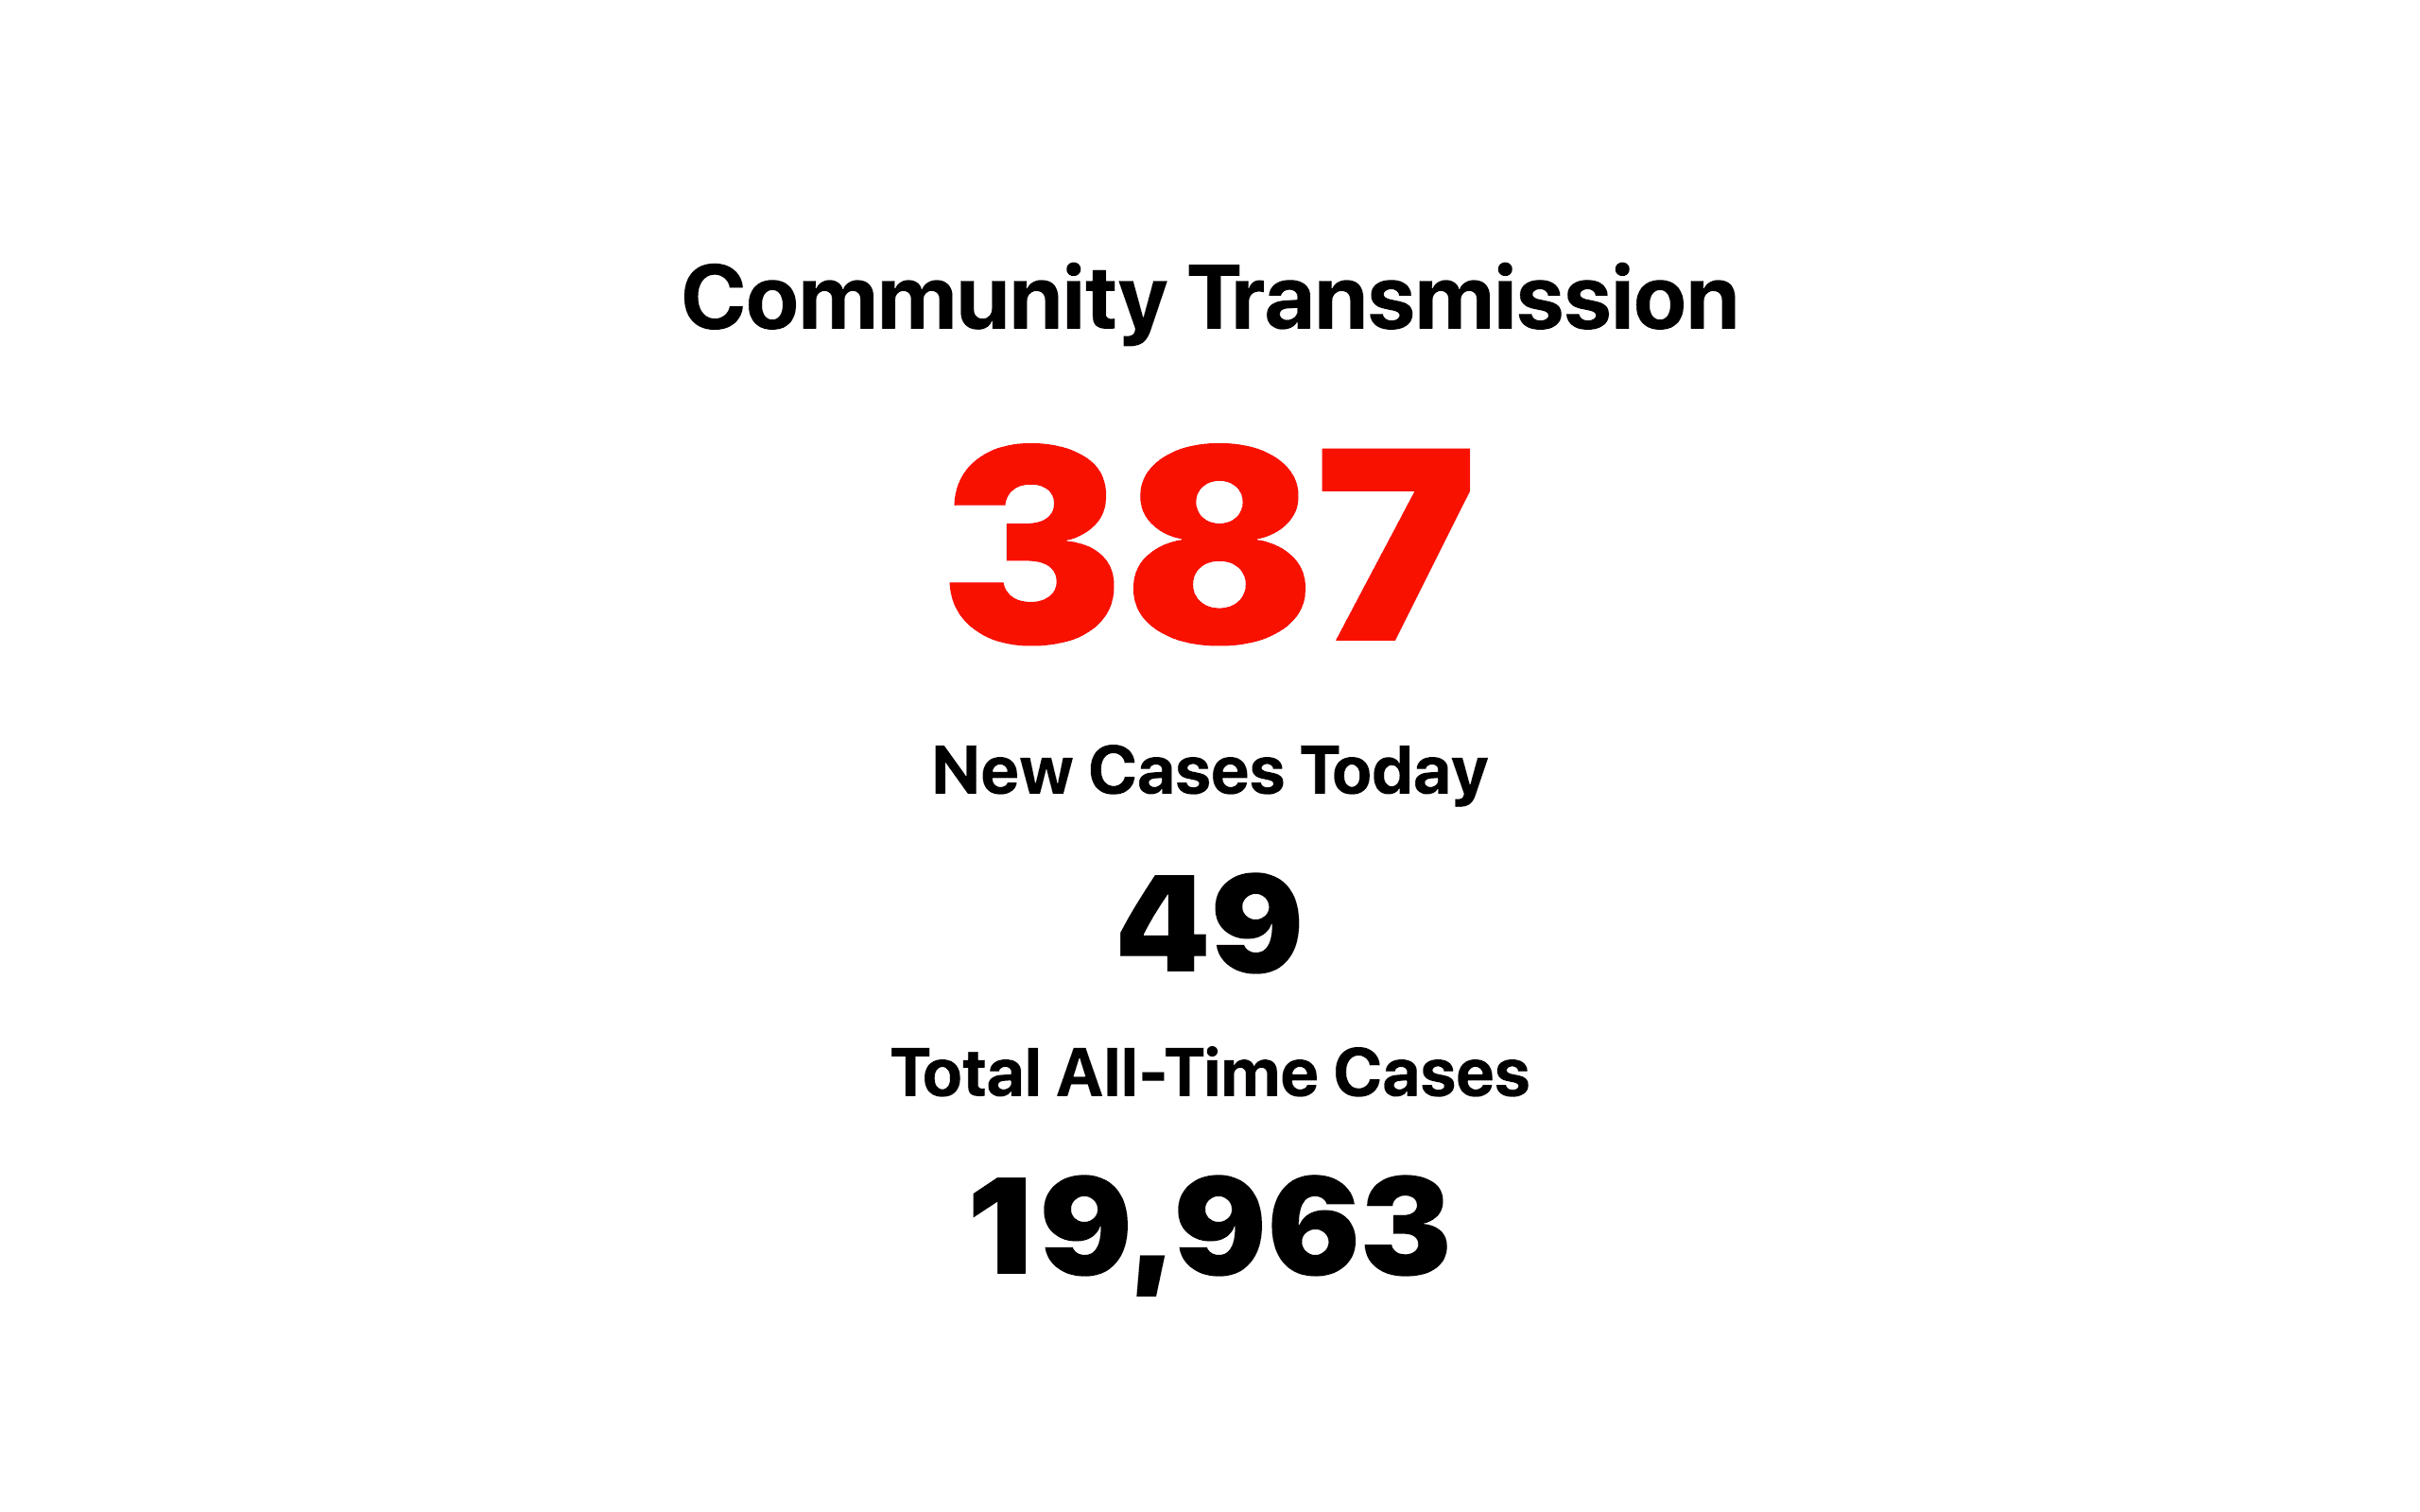
This minimalistic app fetches covid data from the Tompkins County Health Department and parses out the most important numbers to show the general status of covid risk in the area. I created this app because I felt like the health department's website was too complicated, and I wanted a super quick overview of the community transmission and case data to guage infection risk in real time.
Build process
I started by writing an API route that uses Axios to fetch CSV data from a public Google Sheet updated by the health department. I figured out how to parse and process that data, doing some math to generate the important numbers based on the data returned from the spreadsheet.
Once that data is processed, I return it as JSON and Next.js renders the page with some conditional styles to color-code the numbers. This project utilizes the server-side rendering built in to Next.js to serve pure, fully rendered HTML to the client.